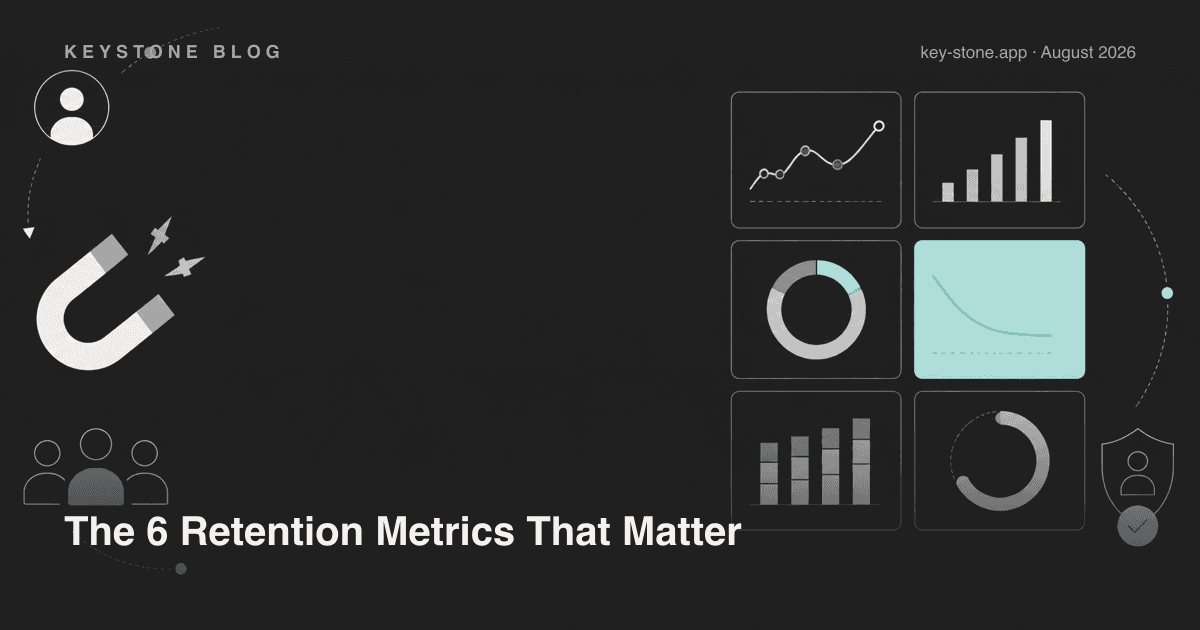
Acquisition tells you how well your marketing works. Retention tells you whether you have a business. If you track only six numbers about your existing customers, track these:
- Repeat purchase rate - the share of customers who come back and buy again.
- Purchase frequency - how many orders the average customer places in a period.
- Time between purchases - how long a customer typically waits before ordering again.
- Customer lifetime value (CLV) - the total revenue an average customer generates before they lapse.
- Churn / lapse rate - the share of customers who stop buying in a given window.
- Redemption rate - for stores with a loyalty program, the share of earned rewards that actually get used.
Here is each one in practice: the formula, where to find it in Shopify, what a healthy reading looks like, and the single action most likely to move it.
1. Repeat Purchase Rate
Formula: returning customers ÷ total customers × 100, over a fixed window (90 days or a year).
Where to find it: Shopify surfaces this as returning customer rate right on the Analytics dashboard, and the Customers over time report lets you split first-time from returning buyers per period.
What good looks like: it depends heavily on what you sell. Consumables - coffee, supplements, pet food, skincare - naturally run far higher repeat rates than durables like furniture or electronics. Compare against your own trend line, not someone else's category. A rate that climbs quarter over quarter is the signal; the absolute number is context.
One action that moves it: a welcome reward aimed at the second purchase. Points earned on the first order plus a reachable first reward gives a one-time buyer a concrete reason to return, which is exactly the gap this metric measures.
2. Purchase Frequency
Formula: total orders ÷ unique customers, over the same period.
Where to find it: divide the two totals from Shopify's sales reports, or read it per cohort in the customer cohort analysis report.
What good looks like: again, category-shaped. The useful question is whether frequency rises after you launch a campaign, not whether you hit a universal number. If average frequency is stuck near one, you have a repeat-purchase problem, not a frequency problem - fix metric #1 first.
One action that moves it: time-limited bonus point campaigns. A double-points weekend or a points multiplier on a slow month gives existing customers a reason to buy now instead of eventually, which is what frequency actually measures.
3. Time Between Purchases
Formula: the median number of days between a customer's consecutive orders. Median beats mean here - a few year-long gaps will wreck an average.
Where to find it: Shopify's cohort analysis shows how quickly each monthly cohort comes back; for the precise median you can export orders and compute the gaps.
What good looks like: shorter than your product's natural consumption cycle. If a bag of coffee lasts three weeks and your median gap is nine, customers are finishing your product and replacing it with someone else's.
One action that moves it: schedule your reminders to land just before the typical gap closes. A points-expiry notice or a “your reward is waiting” nudge timed to day 25 of a 30-day cycle reaches customers exactly when the repurchase decision happens.
4. Customer Lifetime Value
Formula: average order value × purchase frequency × average customer lifespan. Use gross margin instead of revenue if you want the honest version.
Where to find it: Shopify's cohort analysis includes cumulative revenue per customer by cohort, which is CLV assembling itself in front of you month by month.
What good looks like: CLV meaningfully above your cost to acquire a customer - and rising cohort over cohort. A store whose newest cohorts are worth less than last year's is shrinking in slow motion, whatever this month's revenue says.
One action that moves it: VIP tiers. CLV is the one metric that compounds across all the others, and tiers are the mechanic built for it: escalating benefits give your best customers a reason to keep their streak alive instead of drifting after the honeymoon.
5. Churn / Lapse Rate
Formula: customers with no purchase in your lapse window ÷ customers active at the start of it. E-commerce churn is fuzzy - nobody cancels - so define lapsed against your own purchase cycle: for example, no order in twice your median time between purchases.
Where to find it: Shopify customer segments can isolate customers who haven't purchased since a chosen date; track the size of that segment monthly.
What good looks like: falling, or at least stable while your customer base grows. A spike in lapse rate is the earliest warning you get - it shows up months before revenue feels it.
One action that moves it: a winback email that leads with the customer's actual points balance. “You have 450 points - that's a reward you've already earned” outperforms a generic we-miss-you discount because it appeals to value the customer already owns.
6. Redemption Rate
Formula: rewards redeemed ÷ rewards earned (or points spent ÷ points issued), over a period.
Where to find it: your loyalty app's analytics - Keystone's dashboard reports earned versus redeemed directly.
What good looks like: counterintuitively, higher. Unredeemed points feel like savings but are actually disengagement: a customer who never redeems has stopped seeing your program as worth anything, and a redemption is strongly associated with a next purchase. Low redemption is a retention problem wearing a cost-savings costume.
One action that moves it: lower the first reward threshold until a typical customer can reach it within one or two orders. A reward nobody reaches is a reward that doesn't exist.
The Mistakes That Undo All Six
- Tracking everything, acting on nothing. Six metrics on a dashboard change nothing. Pick the weakest one each quarter and run one experiment against it.
- Blending new and returning revenue. A strong acquisition month hides a retention slide. Split every revenue view into first-time versus returning before drawing conclusions.
- Ignoring cohorts. Aggregate numbers mix your loyal 2024 customers with last week's signups. Cohort views are where retention problems - and wins - actually show up.
Turning Measurement Into Revenue
Every action above - welcome rewards, bonus campaigns, expiry nudges, VIP tiers, winbacks - is a loyalty mechanic. That's not a coincidence: a loyalty program is essentially a retention toolkit with analytics attached. If you want to model the math before committing, our free loyalty ROI calculator and the other calculators let you plug in your own order volume and margins and see what a lift in repeat rate is actually worth.
Related reading
- The 5 Loyalty Program Metrics That Actually Matter
- The Three Loyalty Metrics That Actually Predict Repeat Revenue
- How to Get Customers to Actually Redeem Their Points
Ready to move these numbers instead of just watching them? Keystone Loyalty gives you points, referrals, winback campaigns and VIP tiers at a third of big-name pricing - with a free plan to start measuring today.